The Analysis ToolPak is an add-in for Microsoft Excel that provides a variety of statistical and data analysis tools. The Analysis ToolPak is a powerful tool that can be used to make sense of large amounts of data. It is especially useful for businesses and organizations that need to track and analyze data to make informed decisions.
It can be used to perform a wide range of tasks, including:
- Descriptive statistics
- Hypothesis testing
- Regression analysis
- Time series analysis
- Data mining
Example of Analysis ToolPak in Excel
The Analysis ToolPak is an Excel add-in program that provides data analysis tools for financial, statistical and engineering data analysis.
To load the Analysis ToolPak add-in, execute the following steps.
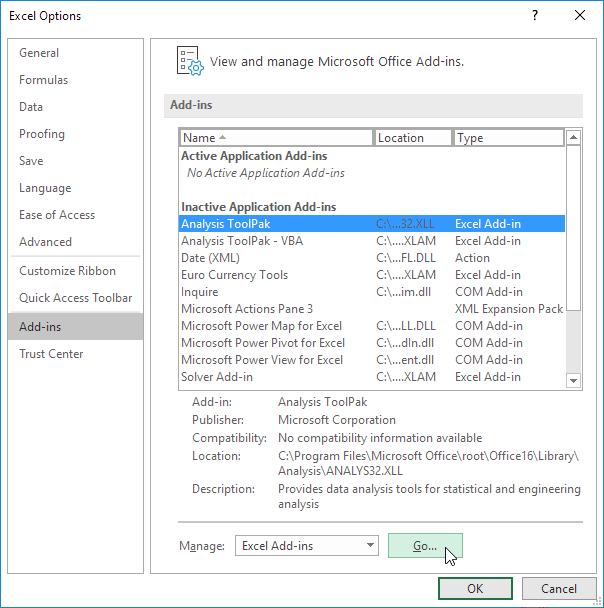
1. On the File tab, click Options.
2. Under Add-ins, select Analysis ToolPak and click on the Go button.
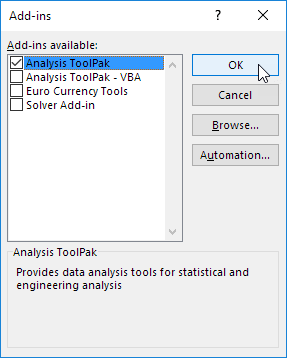
3. Check Analysis ToolPak and click on OK.
4. On the Data tab, in the Analysis group, you can now click on Data Analysis.
Data Analysis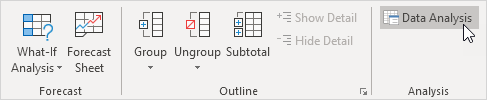
The following dialog box below appears.
5. For example, select Histogram and click OK to create a Histogram in Excel.

Most Commonly used Tools
Here are some of the most commonly used tools in the ToolPak:
- Descriptive Statistics: This tool calculates basic statistical measures for a data set, such as the mean, median, mode, standard deviation, and variance.
- Hypothesis Testing: This tool tests whether there is a significant difference between two or more groups.
- Regression Analysis: This tool models the relationship between two or more variables.
- Time Series Analysis: This tool analyzes data that changes over time.
- Data Mining: This tool finds patterns and trends in data.
The Analysis ToolPak is a powerful tool that can be used to make sense of large amounts of data. It is especially useful for businesses and organizations that need to track and analyze data to make informed decisions.
Additional Tips
Here are some additional tips for using the ToolPak:
- Read the help file for each tool to learn more about its features and options.
- Use the sample data provided in the help file to practice using the tools.
- Save your work often, especially if you are working with large data sets.
- Be sure to understand the limitations of the tools. For example, the Analysis ToolPak does not perform statistical tests for significance.
This is a valuable resource for anyone who needs to analyze data. With a little practice, you can use it to perform a wide range of tasks, from basic descriptive statistics to complex regression analysis.
| Next Chapter: Create a Macro |