What-If Analysis in Excel is a set of tools that allow you to change the values in cells and see how those changes affect the outcome of formulas on the worksheet. This can be useful for exploring different scenarios and making informed decisions about your data.
There are three main types of What-If Analysis tools in Excel:
- Scenario Manager: This tool allows you to create and save multiple sets of values, or scenarios, that you can then compare.
- Goal Seek: This tool allows you to find the value that you need to enter in a cell in order to achieve a desired result.
- Data Table: This tool allows you to create a table of results that shows how different values in one cell affect the values in other cells.
Example
Assume you own a book store and have 100 books in storage. You sell a certain % for the highest price of $50 and a certain % for the lower price of $20.

If you sell 60% for the highest price, cell D10 calculates a total profit of 60 * $50 + 40 * $20 = $3800.
Create Different Scenarios
But what if you sell 70% for the highest price? And what if you sell 80% for the highest price? Or 90%, or even 100%? Each different percentage is a different scenario. You can use the Scenario Manager to create these scenarios.
Note: You can simply type in a different percentage into cell C4 to see the corresponding result of a scenario in cell D10. However, what-if analysis enables you to easily compare the results of different scenarios. Read on.
1. On the Data tab, in the Forecast group, click What-If Analysis.

2. Click Scenario Manager.
The Scenario Manager dialog box appears.
3. Add a scenario by clicking on Add.

4. Type a name (60% highest), select cell C4 (% sold for the highest price) for the Changing cells and click on OK.

5. Enter the corresponding value 0.6 and click on OK again.

6. Next, add 4 other scenarios (70%, 80%, 90% and 100%).
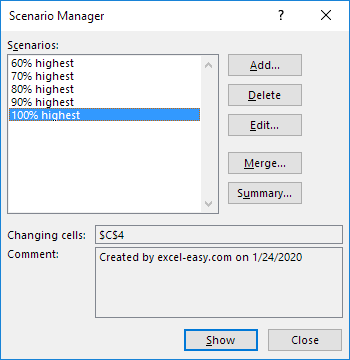
Finally, your Scenario Manager should be consistent with the picture below:
Note: to see the result of a scenario, select the scenario and click on the Show button. Excel will change the value of cell C4 accordingly for you to see the corresponding result on the sheet.
Scenario Summary
To easily compare the results of these scenarios, execute the following steps.
1. Click the Summary button in the Scenario Manager.
2. Next, select cell D10 (total profit) for the result cell and click on OK.

Result:

Conclusion: if you sell 70% for the highest price, you obtain a total profit of $4100, if you sell 80% for the highest price, you obtain a total profit of $4400, etc. That’s how easy what-if analysis in Excel can be.
Goal Seek
What if you want to know how many books you need to sell for the highest price, to obtain a total profit of exactly $4700? You can use Excel’s Goal Seek feature to find the answer.
1. On the Data tab, in the Forecast group, click What-If Analysis.
2. Click Goal Seek.

The Goal Seek dialog box appears.
3. Select cell D10.
4. Click in the ‘To value’ box and type 4700.
5. Click in the ‘By changing cell’ box and select cell C4.
6. Click OK.

Result. You need to sell 90% of the books for the highest price to obtain a total profit of exactly $4700.

Note: visit our page about Goal Seek for more examples and tips.
What-If Analysis is a powerful tool that can help you to make better decisions about your data. By using these tools, you can explore different scenarios and see how they affect your results. This can help you to make more informed decisions and to improve your understanding of your data.
Here are some shortcuts for What-If Analysis in Excel:
- Scenario Manager:
Alt+F11 - Goal Seek:
Ctrl+G - Data Table:
Alt+T
| Next Chapter: Solver |